
As a brutal heat wave sweeps across major energy-consuming regions, the natural gas market stands at a crossroads between surging cooling demand and comfortable inventory levels. Prices have shown upward momentum this week as temperatures break records, testing power grids and driving electricity generation needs.
While storage facilities remain adequately supplied, experts warn that pipeline maintenance and robust LNG exports could create unexpected tightness during peak demand periods. The coming weeks will reveal whether current inventories can withstand what may become one of summer’s most intense consumption surges.
Market analysts are divided on whether this price rally signals a lasting trend or a temporary weather-driven spike, with technical indicators suggesting $3.65 as a critical resistance level. Commercial buyers face tough decisions as volatility persists through cooling season.
- Natural gas prices are rising due to heat wave demand, with futures reaching $3.591 as cooling needs strain power grids, though current storage levels remain within the five-year range.
- LNG exports and pipeline maintenance are creating supply pressures, with June exports at 14.3 bcfd, while production increases to 105.9 bcfd may stabilize prices if injections continue.
- Market volatility persists as weather-driven demand spikes could deplete inventories faster than replenishment rates, with key price support at $3.375 and resistance near $3.65.
Will Rising Gas Prices Follow Heat Wave Demand or Will Increased Inventories Stabilize the Market?
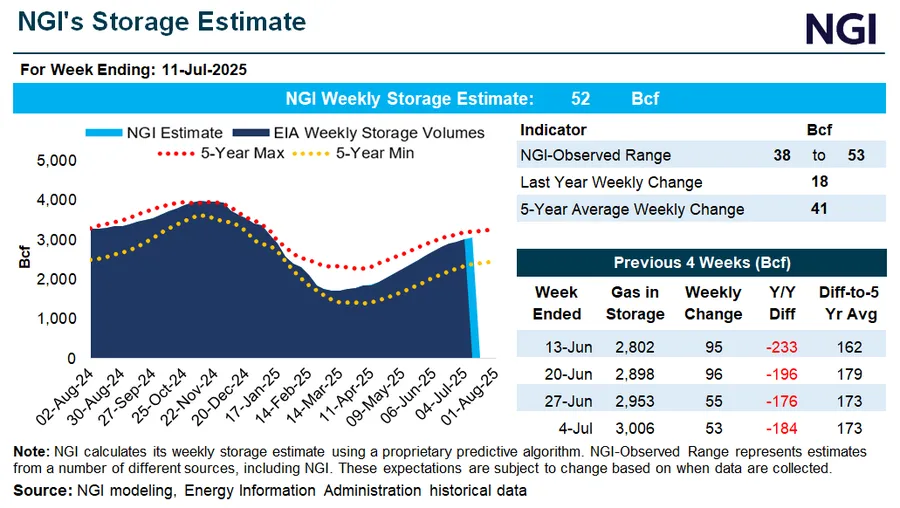
As extreme heat blankets major U.S. regions, the natural gas market stands at a critical juncture. Prices have risen 1.13% this week, with Henry Hub front-month futures reaching $3.591, as cooling demand spikes threaten to outpace inventory builds. The Energy Information Administration reports storage levels currently sit at 2,963 Bcf – comfortably within the five-year range – but meteorologists predict potentially record-breaking temperatures through August that could dramatically alter this balance.
The market faces opposing forces: strong production at 105.9 bcfd versus weather-driven demand surges that could increase power burns by 25%. Pipeline maintenance schedules and LNG export fluctuations add further complexity to supply dynamics. Analysts warn that if injection rates slow during peak cooling season, the current storage cushion might prove insufficient.


Inventory Levels: Protection or False Security?
While total working gas inventories appear adequate at 15% above the five-year average, regional disparities tell a different story:
| Region | Current Inventory | 5-Year Average |
|---|---|---|
| South Central | 1,145 Bcf | 1,210 Bcf |
| Midwest | 825 Bcf | 790 Bcf |
| East | 560 Bcf | 510 Bcf |
This geographical imbalance means some regions face greater vulnerability to price spikes if prolonged heat drives unprecedented cooling demand. The South Central region, home to major LNG export terminals, already shows inventory levels below historical norms.
Heat Wave Impact: How Extreme Temperatures Could Reshape Gas Markets
Forecast models predict temperatures 10-15°F above normal across Texas, the Southwest, and Midwest through late July. Such conditions typically increase power sector gas demand by 5-7 bcfd above seasonal expectations. The timing proves particularly challenging as it coincides with planned pipeline maintenance that could restrict 1-2 bcfd of capacity.
Key demand drivers during heat waves include:
- Electricity generation for air conditioning (50-60% of incremental demand)
- Industrial co-generation plants increasing output
- Compressor stations requiring more fuel for pipeline operations
Historical patterns suggest every 1°F increase above normal summer temperatures adds approximately 0.5 bcfd to national gas demand. With some regions forecasting 15°F anomalies, the math becomes concerning for market balance.
The LNG Export Wildcard: Global Factors Influencing Domestic Prices
While U.S. LNG exports dipped slightly to 14.3 bcfd in June, they remain a significant demand source that connects domestic markets to global price dynamics. Recent developments include:
- European storage nearing 75% capacity, reducing immediate LNG pull
- Asian spot prices stabilizing at $12/mmBtu, down from winter peaks
- Freeport LNG ramping back to 90% capacity after 2022 outage
This creates a complex situation where domestic price sensitivity to exports depends on both international demand and domestic supply conditions. During periods of tight U.S. balances, even modest LNG export volumes can significantly impact pricing.
Infrastructure Constraints and Their Price Implications
The U.S. gas pipeline network faces several challenges that could amplify price volatility:
| Constraint | Impact | Timeframe |
|---|---|---|
| Permian pipeline maintenance | 0.8 bcfd capacity reduction | July-August |
| Gulf Coast LNG feedgas variability | ±1.2 bcfd swings | Ongoing |
| Northeast takeaway limits | Local price depression | Structural |
These constraints mean that even with adequate national supply, regional price spikes could occur during demand surges as gas struggles to reach where it’s needed most.
Price Forecast: Technical and Fundamental Outlook
Market technicians identify several critical price levels that could determine market direction:
- Support at $3.375: The breakout point from last week’s consolidation
- Resistance at $3.65: February highs and Fibonacci extension level
- Psychological $4.00 barrier: Would require sustained demand shocks to breach
Fundamentally, the market appears caught between:
- Bullish factors: Heat wave demand, structural LNG exports
- Bearish factors: Strong production, storage surplus potential

Strategic Considerations for Commercial Buyers
Energy managers face challenging decisions in this environment. Current forward prices suggest:
| Timeframe | Price | Hedging Recommendation |
|---|---|---|
| Q3 2025 | $3.45-$3.75 | Scale-in above $3.60 |
| Winter 2025-26 | $4.10-$4.40 | Wait for pullback below $4.00 |
| Calendar 2026 | $3.80-$4.10 | Accumulate below $3.90 |
Portfolio approaches prove most effective, blending fixed-price contracts with index-linked purchases to balance budget certainty with flexibility. The potential for both upside spikes and downside corrections suggests avoiding all-or-nothing strategies.
The Hurricane Factor: Potential Black Swan Event
While not currently priced in, tropical storm systems pose late-summer risks:
- Historical average of 1.5 major Gulf hurricanes per season
- Potential for 2-4 bcfd production shut-ins
- LNG export facility vulnerabilities
The 2020-2023 period saw three instances where storms caused price spikes exceeding 20% within days. Forecasters currently predict an active season, though storm tracks remain unpredictable beyond 7-10 days.

Long-Term Market Structure: Beyond the Summer Heat
While weather dominates near-term price action, structural factors will determine winter prices and beyond:
- Production growth: Can drillers maintain 106+ bcfd amid capital discipline?
- LNG export capacity: 5 bcfd of new projects under construction
- Power sector demand: Coal retirements add 1-2 bcfd annual gas demand
These fundamentals suggest that even if summer prices retreat post-heat wave, the winter strip may find support from longer-term demand growth. The market appears to be transitioning from cyclical oversupply to more balanced conditions.
Comments