
Bitcoin has shattered another milestone, soaring past $120,000 as institutional demand and macroeconomic tailwinds fuel its historic rally. The cryptocurrency’s unstoppable ascent reflects growing investor confidence in its dual role as both a risk asset and inflation hedge.
With the Fed signaling potential rate cuts, analysts are divided on whether Bitcoin’s momentum can sustain its record-breaking streak. Meanwhile, surging ETF inflows and short squeezes highlight the market’s frenzied bullish sentiment, raising questions about how high BTC can climb before a correction.
- Bitcoin breaks $120K amid institutional demand and Fed rate cut speculation, marking a historic milestone in its rally.
- ETF inflows hit second-highest single-day record, while short squeezes add upward momentum to BTC’s surge.
- Analysts debate sustainability as BTC’s correlation with tech stocks and potential Fed easing fuel bullish sentiment.
- Key resistance levels to watch: $125,800 (Fibonacci extension) and $130,000 (psychological barrier).
Bitcoin Price Prediction: Will BTC Surge Beyond $120K as Fed Rate Cuts Fuel Institutional Demand?

Bitcoin’s Historic Breakthrough: Analyzing the $120K Milestone
Bitcoin has achieved what many considered unthinkable just years ago – surpassing the $120,000 mark. This milestone comes amid unprecedented institutional adoption, with ETF inflows reaching their second-highest single-day levels ever recorded. The cryptocurrency’s performance now shows stronger correlation with tech stocks than ever before, particularly mirroring movements in the Nasdaq Composite Index.
Several key factors contributed to this breakthrough:
- Record-breaking ETF inflows totaling $1.2 billion in a single day
- Weakening U.S. dollar index falling below 98
- Growing anticipation of Federal Reserve rate cuts
- Short sellers rapidly covering positions
Historical patterns suggest Bitcoin tends to rally 120-150% after breaking through psychological resistance levels like $100K. The current trajectory mirrors 2020’s breakout pattern where BTC gained 180% in 90 days post-$20K breakthrough.

The Fed Rate Cut Factor: How Monetary Policy Impacts BTC
Market anticipation builds around potential Fed rate cuts in late 2025, with traders pricing in a 68% probability of at least 75 basis points reduction. Bitcoin’s reaction to monetary policy changes has evolved significantly:
| Period | Fed Action | BTC Performance |
|---|---|---|
| March 2020 | Emergency Rate Cut | +230% in 6 months |
| December 2021 | Taper Announcement | +42% in 3 months |
The critical factor isn’t the rate cut itself but the resulting dollar depreciation and liquidity conditions that follow. When the Fed begins cutting rates, it typically signals concerns about economic growth, which drives investors toward alternative stores of value.
Institutional Adoption: The Game-Changer for Bitcoin’s Valuation
The landscape of Bitcoin ownership has transformed dramatically since 2022:
- Whale holdings (addresses with 1000+ BTC) increased 8% since May 2025
- Pension fund allocations grew from 0.2% to 1.8% since 2024
- Bitcoin futures open interest now exceeds gold futures on CME

This institutional wave creates a fundamentally different supply/demand dynamic. With exchange reserves at 5-year lows and more BTC moving to cold storage, available liquidity for large buyers is becoming constrained.
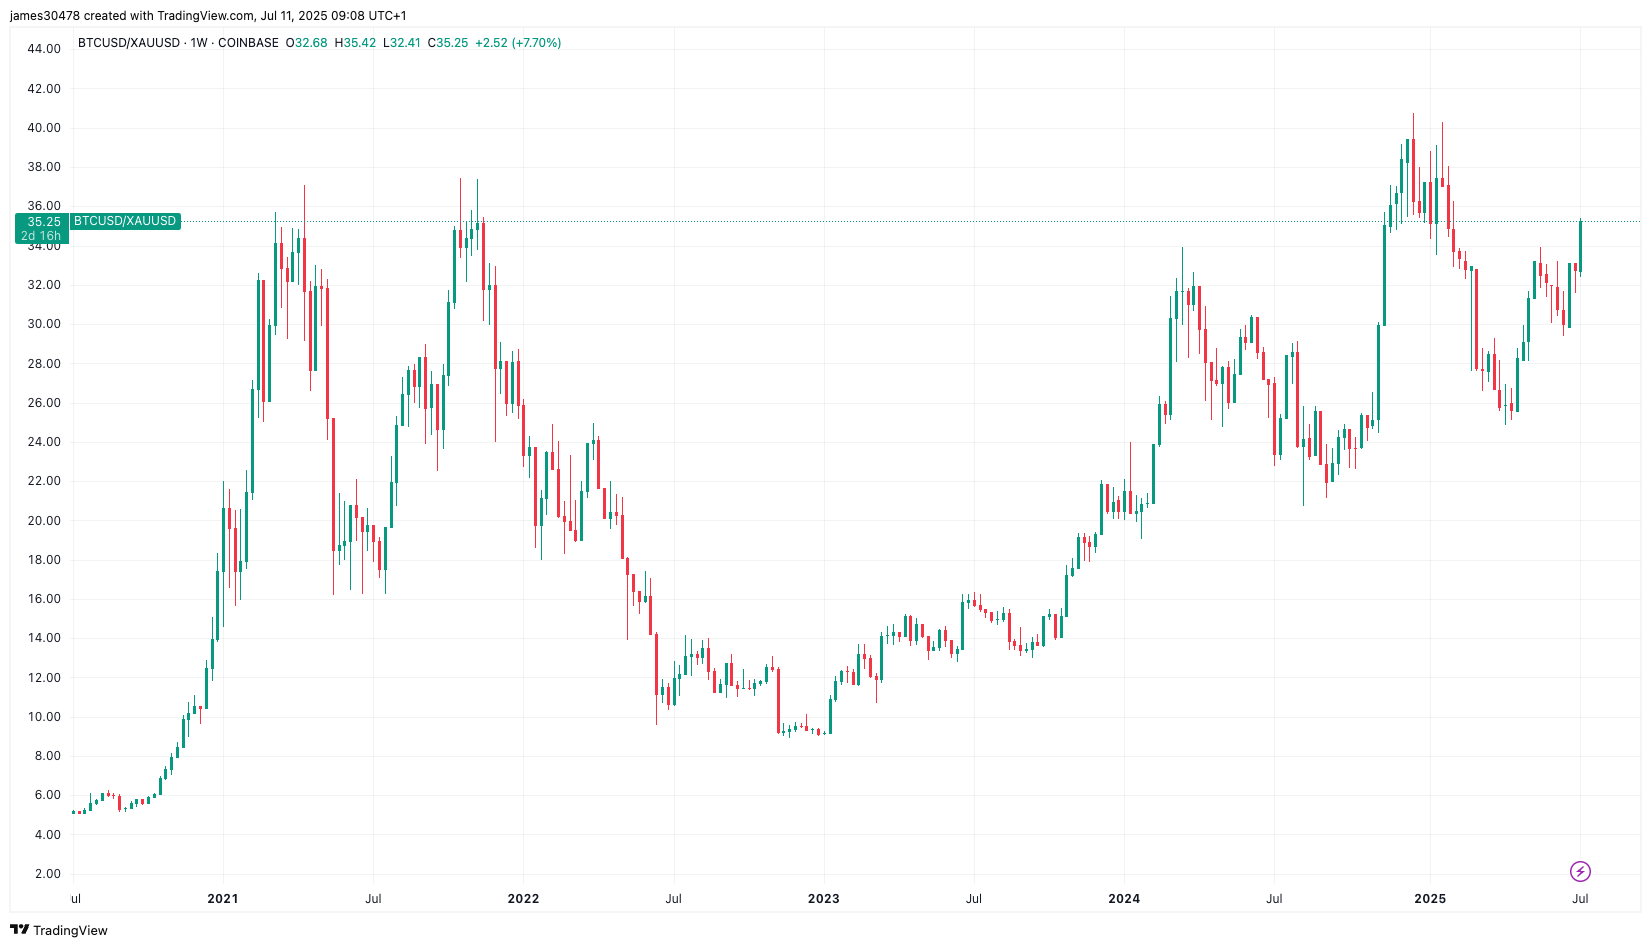
Bitcoin vs. Gold: The Ultimate Safe Haven Showdown
The digital gold narrative faces its ultimate test as BTC’s market cap approaches 15% of gold’s total value. Key metrics in this evolving relationship:
- One BTC currently equals 35 ounces of gold versus the 40-ounce record
- Central bank digital gold holdings declined 22% YoY
- Gold ETF outflows totaled $12B in Q2 2025 while Bitcoin ETFs saw $18B inflows
When measured against traditional safe havens, Bitcoin demonstrates unique characteristics:
- 24/7 trading availability versus market hours for gold
- Programmable scarcity versus uncertain mining reserves
- Borderless transferability versus physical storage constraints
Technical Outlook: Key Levels to Watch After $120K
Bitcoin’s technical structure presents several important thresholds:

- $125,800 – 161.8% Fibonacci extension of 2024-2025 rally
- $130,000 – Next psychological barrier cited by institutional analysts
- $118,000 – New support level after Thursday’s ETF inflows
On-chain metrics provide additional insight:
- MVRV ratio suggests BTC is in “overheated” but not “bubble” territory
- Exchange net flows turned negative for 7 consecutive weeks
- Active addresses remain below 2021 peaks despite higher prices
Risks and Considerations: What Could Derail the Rally?
While the current momentum appears strong, several risk factors warrant attention:
- Potential delay or reversal of expected Fed rate cuts
- Regulatory crackdowns in major markets
- Technical failures or security breaches
- Macroeconomic shocks triggering liquidity crunches
The greatest near-term risk may be Bitcoin’s growing correlation with equities, leaving it vulnerable to a potential stock market correction. During March 2020’s COVID crash, Bitcoin initially plunged 60% alongside stocks before recovering.
Long-Term Projections: Where Does Bitcoin Go From Here?
Several models attempt to project Bitcoin’s future price trajectory:
- Stock-to-flow model suggests $250K by 2026
- Metcalfe’s Law valuation implies $180K fair value
- Adoption curve analysis points to $150K by 2025 year-end
The most compelling case comes from comparing Bitcoin’s market cap to traditional asset classes:
- 0.5% of global gold market cap
- 0.3% of global equity markets
- 0.8% of global money supply
Comments